Showing parameter maps with color
This page introduces two things:
- Blending a structural image with a parameter (“activation”) image;
- Using spatial smoothing to improve signal to noise.
Doing the analysis
This is our familiar analysis for the example image:
>>> # import some standard librares
>>> import numpy as np
>>> import numpy.linalg as npl
>>> import matplotlib.pyplot as plt
>>> import nibabel as nib
We load the image:
>>> img = nib.load('ds114_sub009_t2r1.nii')
Knock off the initial 4 scans because of the signal artefact we’ve seen before:
>>> data = img.get_data()[..., 4:]
>>> vol_shape, n_trs = data.shape[:-1], data.shape[-1]
Get the mean functional. We will use this as a structural image on which we will display the parameter maps. We also use it to make a mask of in-brain voxels:
>>> mean_data = np.mean(data, axis=-1)
>>> mask = mean_data > 900
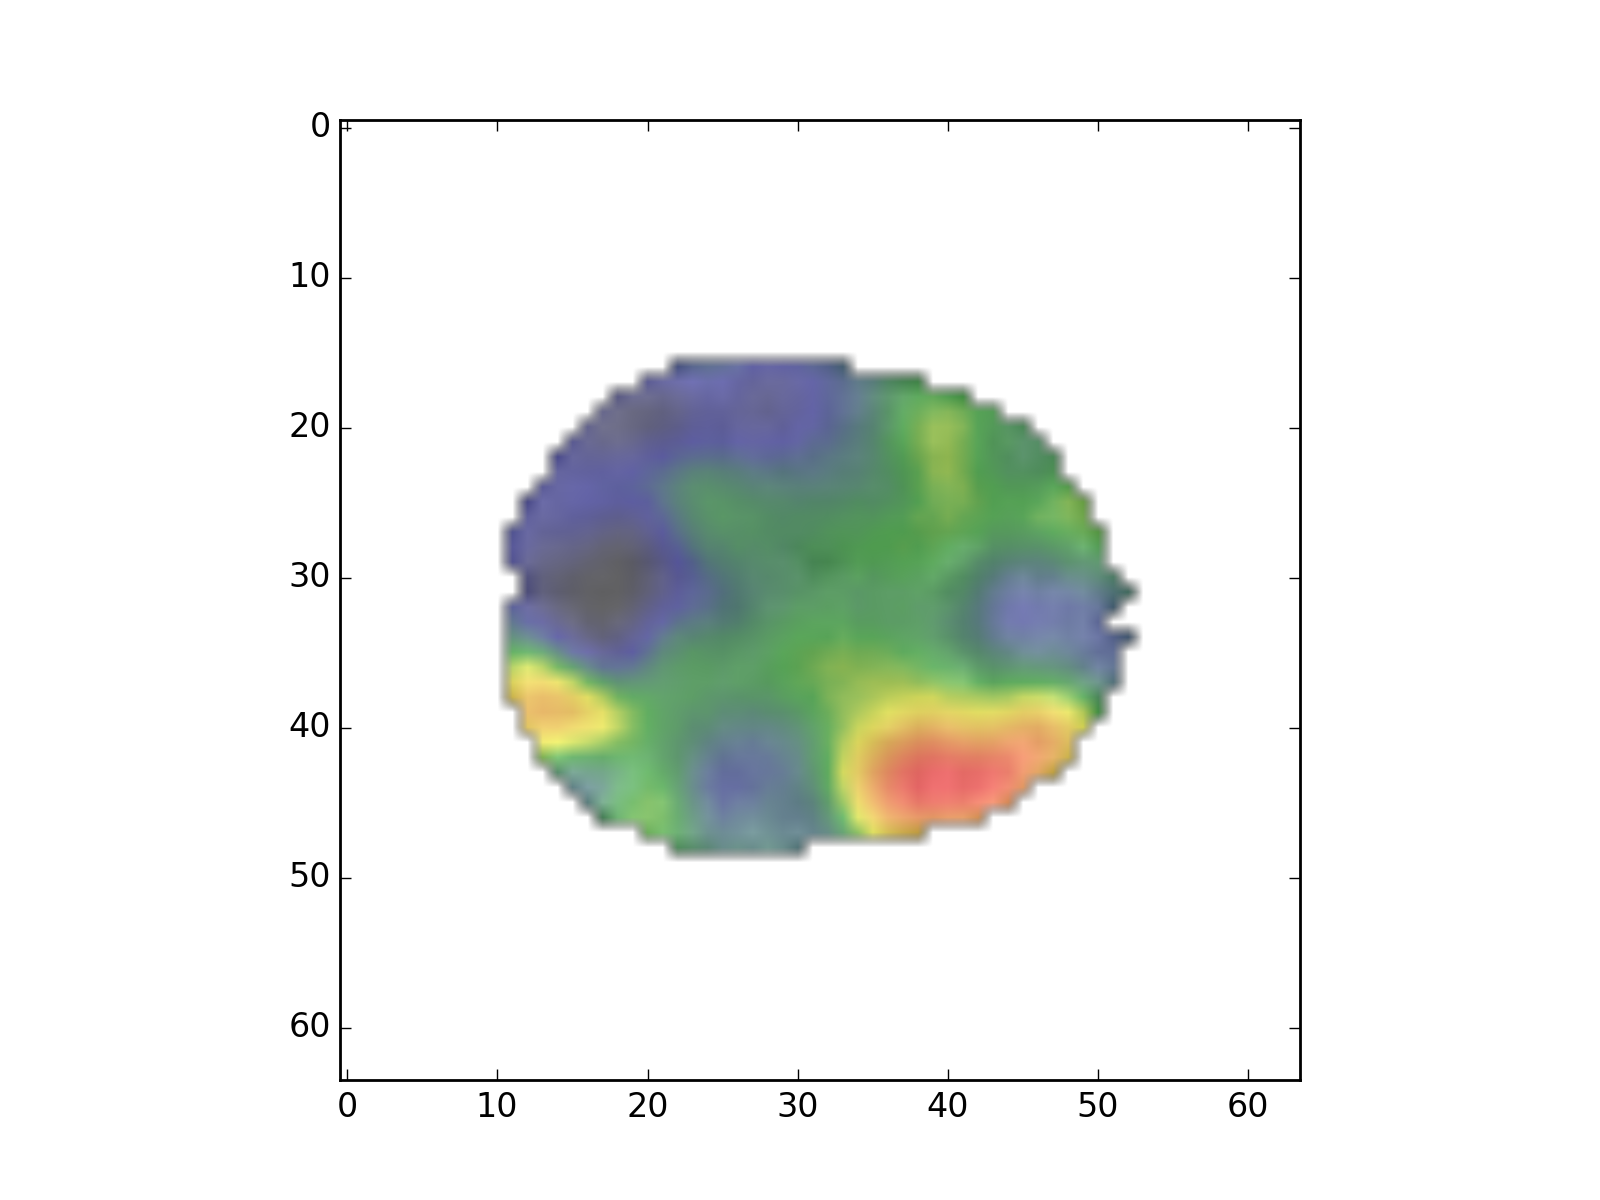
The signal in the images extends across several voxels, because nearby brain locations usually have similar response to the task. However, the noise in the data is mostly independent from one voxel to the next. Smoothing in space therefore reduces the noise by averaging across the independent noise in the voxels, while preserving the signal:
>>> from scipy.ndimage import gaussian_filter
>>> # Smooth by 2 voxel SD in all three spatial dimensions
>>> smooth_data = gaussian_filter(data, [2, 2, 2, 0])
Make the data matrix and design matrix. We use the convolved
regressor that we have used before.
>>> Y = smooth_data[mask].T
>>> P = 3  # number of parameters == columns in model
>>> X = np.ones((n_trs, P))
>>> X[:, 0] = np.loadtxt('ds114_sub009_t2r1_conv.txt')[4:]
>>> X[:, 1] = np.linspace(-1, 1, n_trs)
Estimate the model, and put the parameters back into their image shape:
>>> betas = npl.pinv(X).dot(Y)
>>> beta_vols = np.zeros(vol_shape + (P,))
>>> beta_vols[mask] = betas.T
Now we are going to display the image. First we set the background (outside
the brain) to not-a-number values
(np.nan). This signals to matplotlib that it should display no color at
these locations:
>>> # set regions outside mask as missing with np.nan
>>> mean_data[~mask] = np.nan
>>> beta_vols[~mask] = np.nan
We could use any colormap for the
parameter (beta) image, but we can also make our own. In this case I am
recreating the colormap used on this page. The data to
recreate the map are at actc.txt.
>>> from matplotlib import colors
>>> nice_cmap_values = np.loadtxt('actc.txt')
>>> nice_cmap = colors.ListedColormap(nice_cmap_values, 'actc')
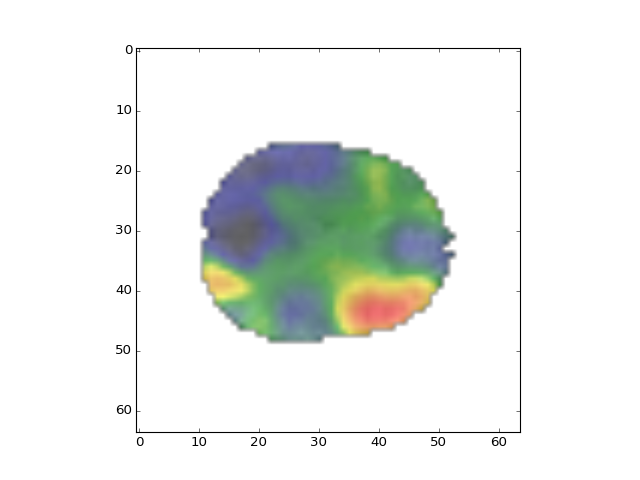
Now we show the structural image (the mean functional) with the functional parameter map image overlaid. We give the structural half of the intensity range, and the functional the other half:
>>> plt.imshow(mean_data[:, :, 14], cmap='gray', alpha=0.5)
<...>
>>> plt.imshow(beta_vols[:, :, 14, 0], cmap=nice_cmap, alpha=0.5)
<...>
