Matrix rank
The rank of a matrix is the number of independent rows and / or columns of a matrix.
For a matrix with more columns than rows, it is the number of independent rows.
For a matrix with more rows than columns, like a design matrix, it is the number of independent columns.
In fact, linear algebra tells us that it is impossible to have more independent columns than there are rows, or more independent rows than there are columns. Try it and see!
A column is dependent on other columns if the values in the column can be generated by a weighted sum of one or more other columns.
To put this more formally - let’s say we have a matrix \(\mathbf{X}\) with \(M\) rows and \(N\) columns. Write column \(i\) of \(\mathbf{X}\) as \(X_{:,i}\). Column \(i\) is independent of the rest of \(\mathbf{X}\) if there is no length \(N\) column vector of weights \(\vec{c}\), where \(c_i = 0\), such that \(\mathbf{X} \cdot \vec{c} = X_{:,i}\).
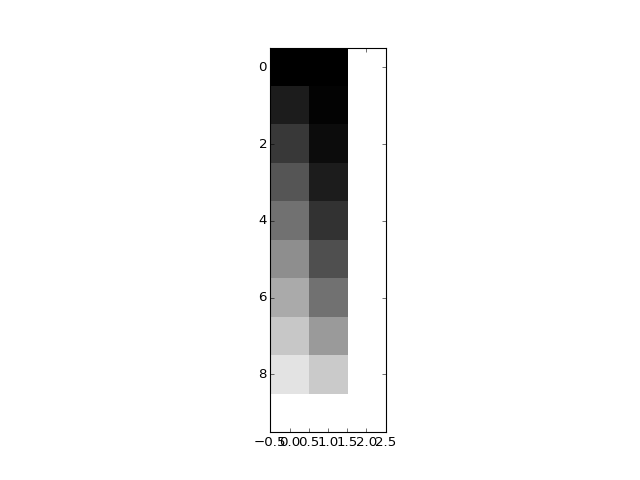
Let’s make a design with independent columns:
>>> trend = np.linspace(0, 1, 10)
>>> X = np.ones((10, 3))
>>> X[:, 0] = trend
>>> X[:, 1] = trend ** 2
>>> plt.imshow(X, interpolation='nearest', cmap='gray')
<...>
In this case, no column can be generated by a weighted sum of the other two.
We can test this with np.linalg.matrix_rank:
>>> import numpy.linalg as npl
>>> npl.matrix_rank(X)
3
This does not mean the columns are orthogonal (or that they have zero correlation).
>>> X.T.dot(X)  # Orthogonal columns have dot products of zero
array([[  3.5185,   2.7778,   5.    ],
       [  2.7778,   2.337 ,   3.5185],
       [  5.    ,   3.5185,  10.    ]])
>>> np.corrcoef(X[:,0], X[:, 1])
array([[ 1.    ,  0.9627],
       [ 0.9627,  1.    ]])
As long as each column cannot be fully predicted by the others, the column is independent.
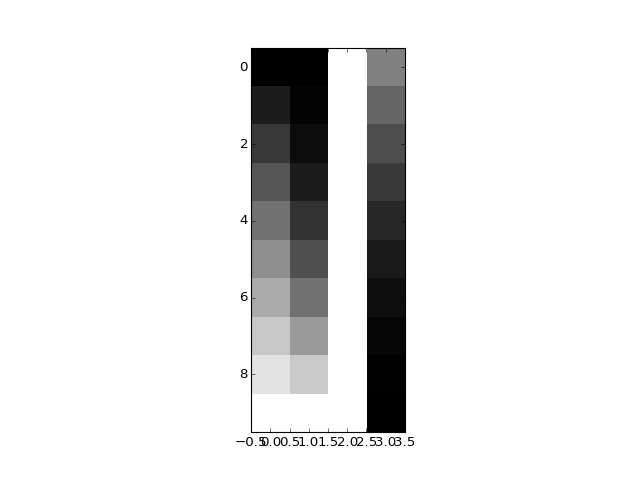
Now let’s add a fourth column that is a weighted sum of the first three:
>>> X_not_full_rank = np.zeros((10, 4))
>>> X_not_full_rank[:, :3] = X
>>> X_not_full_rank[:, 3] = np.dot(X, [-1, 0.5, 0.5])
>>> plt.imshow(X_not_full_rank, interpolation='nearest', cmap='gray')
<...>
matrix_rank is up to the job:
>>> npl.matrix_rank(X_not_full_rank)
3
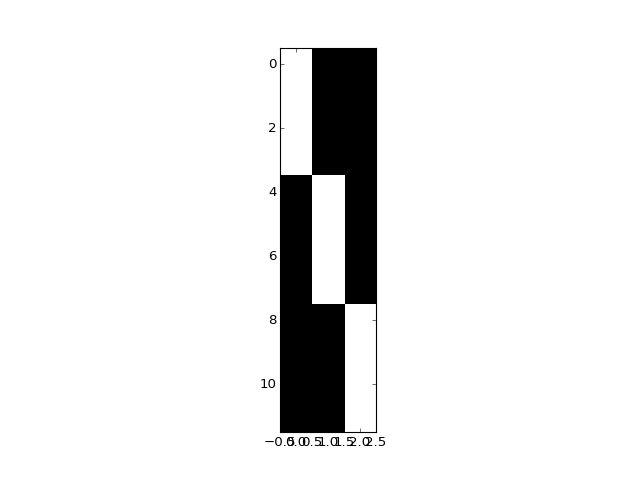
A more typical situation with design matrices, is that we have some dummy variable columns coding for group membership, that sum up to a column of ones.
>>> dummies = np.kron(np.eye(3), np.ones((4, 1)))
>>> plt.imshow(dummies, interpolation='nearest', cmap='gray')
<...>
So far, so good:
>>> npl.matrix_rank(dummies)
3
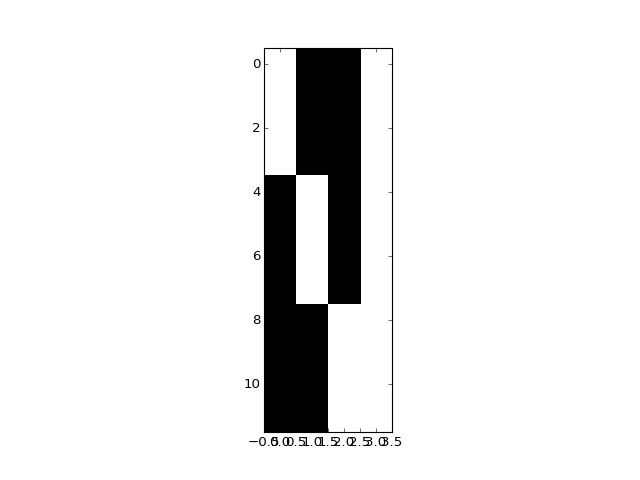
But if we add a column of ones to model the mean:
>>> dummies_with_mean = np.hstack((dummies, np.ones((12, 1))))
>>> plt.imshow(dummies_with_mean, interpolation='nearest', cmap='gray')
<...>
>>> npl.matrix_rank(dummies_with_mean)
3
